AWS Tutorial 14 - Diagnosing SSH Failures Take 2
As I wrote about in AWS Tutorial 10, we had an issue with AWS instances losing the their ability to SSH into them. That was written on October 1st and since then we've seen it happen over and over again. Getting this kind of problem addressed requires really good diagnostic skills and there is always a lot to learn from the troubleshooting process. I dragged a consultant in for an hour of screen sharing figuring that even one good idea would just the cost of the hour. And here was the result of his talks with me:
Disk Space?
Rule number 1 is always start with disk space. The consultant brought this up first thing and I agree whole heartedly. Happily I'm now an ansible user so I was able to show off this:
ansible all -i inventories/production2 -u ubuntu -a "df -h"

fiweb1 | SUCCESS | rc=0 >>
Filesystem      Size  Used Avail Use% Mounted on
udev             32G   12K   32G   1% /dev
tmpfs           6.3G  384K  6.3G   1% /run
/dev/xvda1      7.8G  3.7G  3.7G  50% /
none            4.0K     0  4.0K   0% /sys/fs/cgroup
none            5.0M     0  5.0M   0% /run/lock
none             32G     0   32G   0% /run/shm
none            100M     0  100M   0% /run/user

ficrawlerbig | SUCCESS | rc=0 >>
Filesystem      Size  Used Avail Use% Mounted on
udev             32G   12K   32G   1% /dev
tmpfs           6.3G  384K  6.3G   1% /run
/dev/xvda1      7.8G  3.7G  3.7G  50% /
none            4.0K     0  4.0K   0% /sys/fs/cgroup
none            5.0M     0  5.0M   0% /run/lock
none             32G     0   32G   0% /run/shm
none            100M     0  100M   0% /run/user
What Do These Boxes Do?
The next step for the consultant was understanding so he asked me "what's going on here?" So I explained that all of these boxes are running a custom built, multi threaded crawler that we call the ucrawler. It is a thread pool style architecture that pops items off a redis queue, processes them and then moves onto the next one. This code was first written in 2011 and has been in daily use ever since. Based on the tens of millions of records of data that this code has processed since 2011, I've been reluctant to point the finger at it. Oh and yeah, I was the author. Sigh. And yet I know all too well that whenever threads are involved, you look at the threads.
Lock Everything Down
Given that AWS is a target rich environment for intrusion, its wise to lock things down so I did the following:
- restricted ssh logins to a small list of IP addresses
- installed fail2ban on all boxes
- turned off all services on crawler boxes other than the crawler itself
Here's the ansible tasks for 2 and 3:
- name: Install fail2ban
  apt: name=fail2ban state=present

- name: stop_sendmail
  service: name=sendmail state=stopped

- name: stop_apache2
  service: name=apache2 state=stopped

- name: stop_redis
  service: name=redis state=stopped

- name: stop_memcached
  service: name=memcached state=stopped
To run this against our fleet of boxes I can just do this for fail2ban (its part of the overall machine_setup role):
ansible-playbook -i inventories/production2 playbook_crawler.yml --tags="machine_setup"
And a similar statement will shut down the services:
ansible-playbook -i inventories/production2 playbook_crawler.yml --tags="services"
Originally I had been planning to have these boxes crawl and provide front end web services. However that thinking is not only bad but also predated my mastering ansible. Now that I can provision boxes to do exactly what I want, well, they will do only one thing – single purpose.
Note: This I did before the consultant.
Shared Tenancy
We used to run on dedicated hardware. Now we are running on "shared tenancy" which means that someone else is using the same box and everything is virtualized. Technically we could be affected by what's referred to as "Nearest Neighbor" problems where a heavy user close to you is a problem. Given that this is happening on 8 out of 8 aws instances, I think that's an unlikely possibility.
Note: This I did before the consultant.
What's Changed?
The consultant's next question was the obvious one – given that this code used to work fine, well, the logical question is "what changed?". Chuckle Well everything:
- data center - from our own on dedicated hardware to AWS on shared tenancy
- ruby version - 1.9.3 to 2.3.1
- rails - 4.1.4 to 4.2.7
- rvm - per user RVM install to system level RVM install
- gemfile and gemfile order
That's a lot of changes. I'll return to this topic.
The Diagnostic Process
The consultant wanted to see everything this actually happen so here's how I went about that.
Step 1: Reboot the World
In order to determine which boxes were actually down, the easiest thing was to run an ansible command like the df -h above and then correlate that to instance ids. Then the EC2 console could be used to reboot machines selectively. Out of 8 crawler boxes we had 7 which needed a reboot. That one box that now has a 15 hour uptime? Its interesting and we'll look at that again.
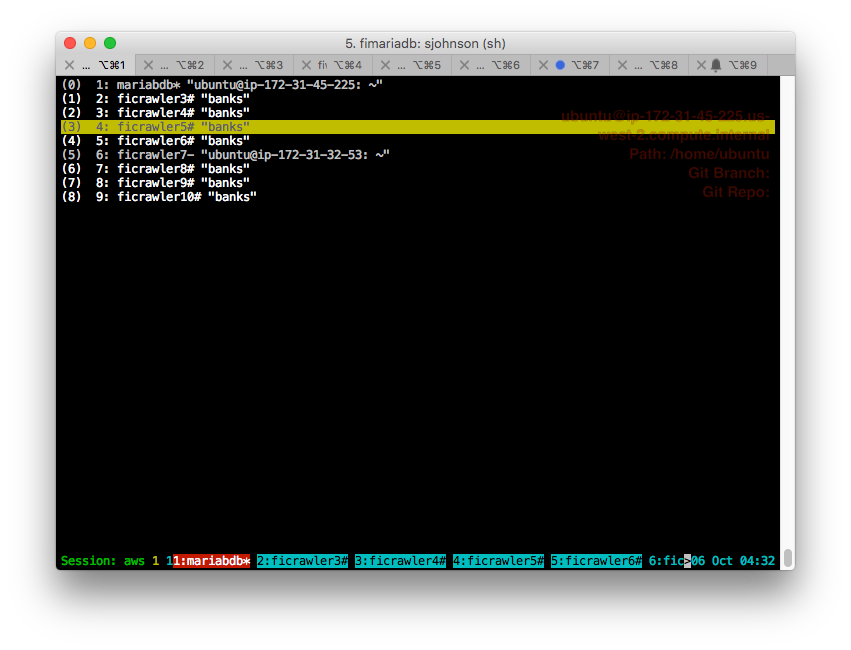
Step 2: SSH Into Everything and Tmux to the Rescue
The next step is to get into every box via SSH. Happily I've set up a Tmuxinator yaml file which I can use to arrow up / arrow down between boxes. And since I run a local tmux installation on a different hot key from the server side one I can effectively tunnel from my local box into the remote boxes and still have tmux available to me.
Note: Tmux is a terminal multiplexer that lets you maintain multiple connections to different boxes and even built a user interface like an IDE out of classical bash terminals. It is one of those technologies that you don't even know is important until you need it and then you don't know how you ever lived without it. Tmuxinator is a Ruby gem which helps with configuration for it since native tmux is kind of sucky.
Once we got into the boxes we executed a tmn crawl_q3 command which created a tmux session for our crawl.
Step 3: Make It Fail Fast
The next step was to get everything running. Once we had ssh'd into the boxes and setup the tmux session, it was just a matter of executing this supervise statement:
cd /var/www/apps/banks/current && supervise /var/www/apps/banks/current/supervise/banks_crawl_25
Supervise is from DJ Bernstein's daemon tools and is my all time favorite way to keep an unreliable process running. Because this is ruby and there are threads involved, we'll see segfaults from time to time and supervise keeps everything running. And, yes, I know that segfaults are another issue but I've lived with crappy ruby performance and reliability for so long now that it just doesn't phase me anymore. I had hoped that they would go away with Ruby 2.3.1 but, well, sigh.
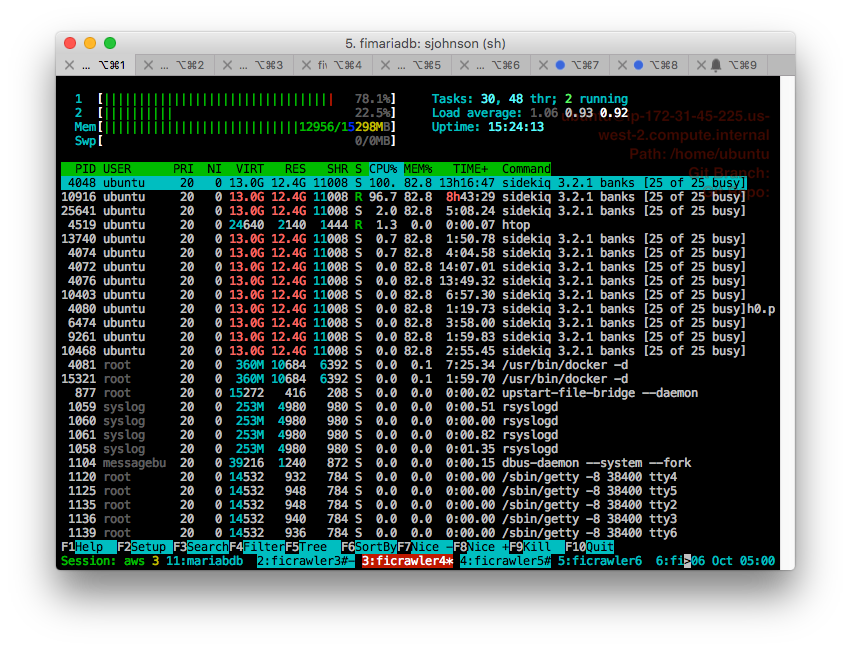
Step 4: Htop and Watch
Since I'm now running ansible I can easily provision a robust set of dev tools on every box. One of those is htop which is just a better version of top – but top itself is wonderful and htop even more wonderful. By running htop across all boxes and then using tmux to easily navigate between them we could watch memory rise dramatically over the course of the crawler's execution.
Step 5: The One Box that Didn't Die Yet
Toggling between htop and the tmux session running the crawler itself let us watch the execution speed. One thing that was interesting was comparing performance (as measured by watching the onscreen logging scroll past) between the box that was still up and the new boxes we had just started. We observed roughly a 5x difference in performance. This is generally an indication of some kind of memory issue whether garbage collection issues or something else. The simple fact that the crawler gets dramatically slower over time is an indication of an overall problem whether memory or threading.
Note: Just watching how things work and then looking across different boxes for similarities or differences is a powerful and often overlooked technique. It is just as important to look with your brain as it is with your eyes – if you don't try and actually understand the meaning of the characteristics you witness, well, it isn't worth much.
Step 6: Wait for It
With all due apologies to Barney, the next step was to just wait for it to happen – ssh to shut down. By running ansible's df -h test from my local box and keeping htop running, what we saw was that when memory usage approached the size of the box itself, well, WHAM! Inbound ssh traffic would shut down. We were able to reliably repeat this across most of the 7 boxes we were using to test things.
Conclusion: Great Ghu It Is An OOM Problem!
When a linux box runs out of memory, there is a software component called the OOM Killer which is supposed to kill the offending process. And, for some bizarre reason, it isn't working. Or, perhaps, it is working and the process getting killed is actually OpenSSH itself. Or maybe it just isn't working. Here's an example from /var/log/syslog and this indicates to me that its not actually working:
grep -i kill /var/log/syslog
Sep 29 13:53:11 ip-172-31-35-106 kernel: [   15.917391] init: failsafe main process (827) killed by TERM signal
Sep 29 13:53:13 ip-172-31-35-106 kernel: [   18.105812] init: plymouth-upstart-bridge main process (231) killed by TERM signal
Oct  3 14:26:12 ip-172-31-32-53 kernel: [   14.846657] init: failsafe main process (747) killed by TERM signal
Oct  3 22:19:59 ip-172-31-32-53 kernel: [28441.944201] ucrawler.rb:213 invoked oom-killer: gfp_mask=0x201da, order=0, oom_score_adj=0
Oct  3 22:19:59 ip-172-31-32-53 kernel: [28441.944237]  [<ffffffff81155ba1>] oom_kill_process+0x201/0x360
Oct  3 22:19:59 ip-172-31-32-53 kernel: [28441.944401] Out of memory: Kill process 25910 (ruby) score 979 or sacrifice child
Oct  3 22:19:59 ip-172-31-32-53 kernel: [28441.948805] Killed process 25910 (ruby) total-vm:16287724kB, anon-rss:15310180kB, file-rss:0kB
Oct  4 08:13:15 ip-172-31-32-53 kernel: [   88.033317] init: failsafe main process (835) killed by TERM signal
Oct  5 08:27:27 ip-172-31-32-53 kernel: [   76.630167] init: failsafe main process (834) killed by TERM signal
Oct  5 15:38:54 ip-172-31-32-53 kernel: [   84.972034] init: failsafe main process (836) killed by TERM signal
Oct  5 18:30:05 ip-172-31-32-53 kernel: [   21.974995] init: failsafe main process (836) killed by TERM signal
This box had ssh go down on it repeatedly from the 3rd to 5th but there's no reference to OOM being invoked after the 3rd. Bizarre. So we've got a hypothesis:
- Something has changed from ruby 1.9.3 to ruby 2.3.1 - maybe it is threading; maybe it is an api that a gem relies on
- The ruby process is bloating up to 15 gigs of ram
- The Linux OOM killer isn't killing the bloated process
- OpenSSH just doesn't have head room to run at all
Now that we have a hypothesis, well, it is time to figure out the solution.
Solving It - The Options
Now that the problem is apparent the question becomes how to solve it in a time sensitive fashion. Right now this is a show stopper for us. We can't generate the data that we need to generate because our crawlers are effectively castrated (a crawler that runs for 30 minutes and then starts to die, well, that's castration for you).
Go Back to 1.9.3 / Old Data Center
I spent literally years of my life fighting the issues in 1.9.3 (2011 to 2016) or as I refer to it "being locked in a 1.9.3 ghetto". I just can't bear to go back and I'd rather gargle glass then go back to my old data center. Fail. An interesting option would be to use htop in the old data center to watch things and see if similar memory patterns emerge but its entirely possible that the old data center had some level of kernel tuning that made it better at OOMM conditions.
AutoScaling Group
Unfortunately the easiest "solution" actually isn't. Remember that none of these boxes are actually "down" as they all pass the AWS monitoring metrics – instance availability and instance reachability. Sigh.
Read the Change Logs
The technically best suggestion of the day was actually the hardest to follow through on – read the change logs. Obviously something changed in Ruby itself and that broke our threading. Unfortunately I actually don't think that reading the change logs will help all that much – this might not be a threading issue but it could also be a change to an API that some gem we rely on uses that is then causing the failure. My great fear here is that N pages of change logs later I'm going "Hm…."
Alternative Threading Library
An obvious idea is to move away from my own thread pool stuff to one of the more modern options like concurrent-ruby. I did some experimentation with it but:
- the documentation is fairly awful; I'm not the only one who thinks so
- I can't find a great way to represent what we did based on their examples
Intellectually I like this idea best but given how much threaded code I've written the fact that I can't see a mapping from what I need to how it works bothers me. It is very possible, however, that it is me. I'm an old dog and sometimes new tricks can be difficult.
Sidekiq
The best option is, somewhat to my dismay, Sidekiq. Sidekiq is an asynchronous job processor and while I have immense respect for Mike Perham, the author, I had a bad experience with a different asynchronous job processor in another life and I've been gun shy ever since. However this is a show stopper and, well, damn the torpedos, full speed ahead. On to Sidekiq! Here's all that was needed to be done:
- add it to Gemfile
- bundle install
- create app/workers/crawler_worker.rb (its a class)
- modify perform to load a site instance and call the crawl method
- modify our queue generation tools to call CrawlWorker.perform_async('', id) (where id is a variable representing the site we want to crawl; it is just an ActiveRecord id so an integer)
- run bundle exec sidekiq on all previously running our own crawler
Note: We actually had sidekiq in our Gemfile already but I wanted the description of steps to be complete. A big part of the reason that I'm writing furiously as of late is to leave an intellectual trail for people who work with me.
The Advantages of Sidekiq
Sidekiq, for us, actually has some real advantages:
- HoneyBadger is supported and, well, you know how much I think the HoneyBadger guys just plain rock.
- Our own crawler has its own load structure and dynamically called classes like HoneyBadger don't come in correctly so this means we'll get better error tracking
- It's by Mike Perham. I always try and know who wrote the tools I rely on because knowing how well they do (or don't do) their jobs tells me how much I can trust their work. And I've been reading Mike's work on threading for about 5 years now. He is my goto source for when I don't understand the hard stuff.
- As I watch 8 boxes running our software but under sidekiq, I'm seeing the same memory growth but what I'm not seeing is the machines dying the way they have been. Out of 9 boxes that have been running for 9 hours and 5 minutes continuously (and working hard) only 1 is down. I don't know what tomorrow will bring and I could wake up and they could all be dead again but, right now, this is a massive improvement. Update from 8 hours later – that one dead box is still dead but all the other boxes are still running and doing great!
- Doing a partially valid comparison of crawling volume in our old data center versus AWS for about 1/3 of one day is showing a 33 % increase in throughput.
Closing Thoughts: This Was Fun!
This was a terrible 72 hours of not really leaving the chair very much but it was also a metric crap ton of fun. Debugging remains the essence of software engineering and this was a very enjoyable deep dive.
Good Unix Command Line Tools
Debugging like this brings a lot of old school unix stuff you don't use every day. Here are some of the things I used figuring this all out:
- list open files for a process id via procfs: ls -l /proc/7857/fd Ref
- list open files for a process id via lsof: lsof -p 351 [Ref])(http://www.cyberciti.biz/faq/howto-linux-get-list-of-open-files/)
- list open files by process name via lsof: lsof -c ssh -c init Ref
- get all current limits: ulimit -a Ref
- get all process ids by name: pgrep sshd Ref
- kill a process by name: pkill bash Ref
-
memory used by a process name: pidof sidekiq xargs ps -o rss,sz,vsz Ref - memory map of a process: pmap -p pid Ref
Other References
Here are a few other things:
Posted In: #aws #ssh #linux #ansible #tmux #tmuxinator #debugging #software_engineering #ruby